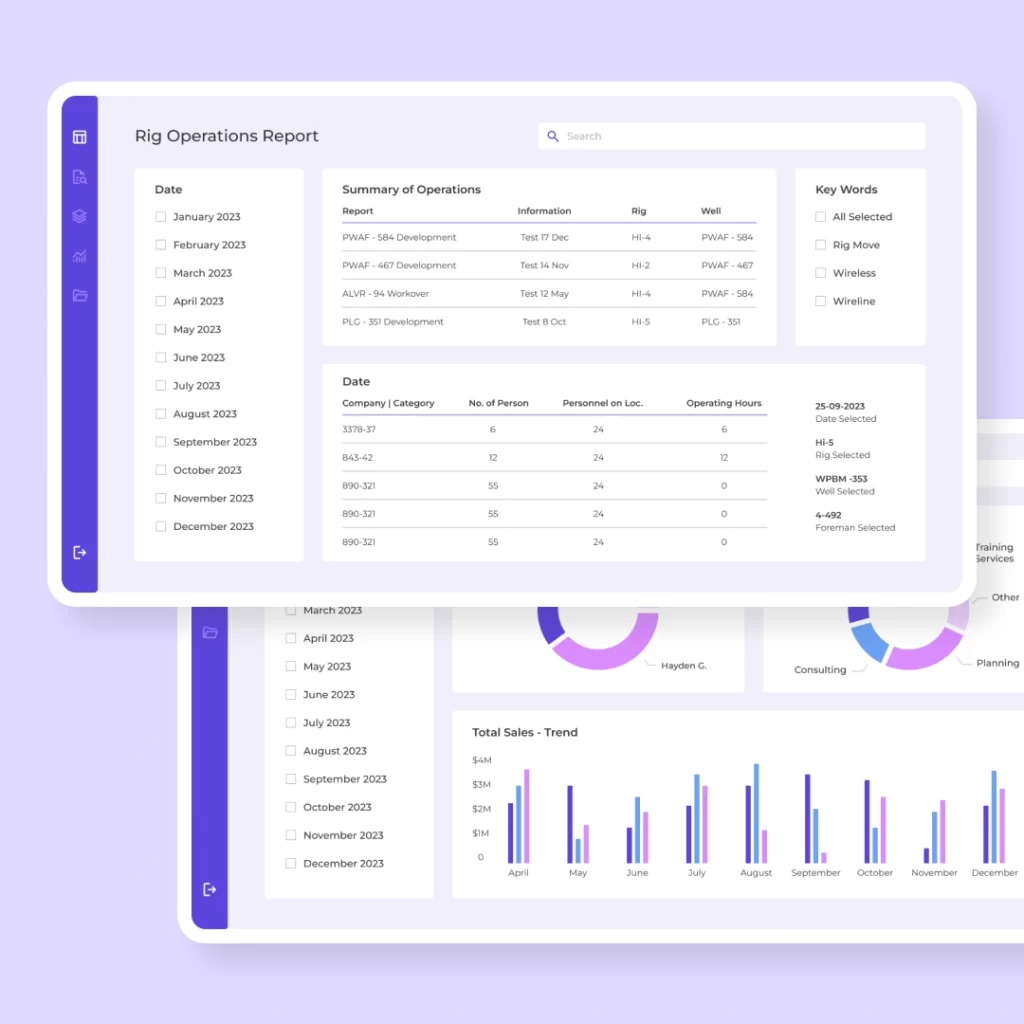
Our dashboard is an ideal tool that filters and verifies operational information. It allows the client to get instant insight into filtered data, saving time and reducing the risk of error. Thanks to process automation, our client can now rest assured that no important information will be missed in the overwhelming daily workload.

Business Intelligence in Action: Verifying 3,000 Reports Daily – Automatically
OUTCOMES
Results of partnership
3,000 reports
automated daily
Automation of manual administrative tasks significantly reduced processing time and operational costs, while also minimising the risk of human error.
3 hours saved
per day
Reports are now generated automatically and made available in real time, eliminating the need for up to three hours of manual analysis each day.
Full access
to historical data
Comprehensive access to historical records enabled multi-dimensional analysis, supporting both operational monitoring and long-term strategic planning.
PROJECT
Genesis and business expectations
A Saudi Arabian Oil & Gas company was receiving detailed daily operational reports in PDF format, each aggregating data from multiple locations. Employees manually searched for keywords within these documents to identify key insights and take further action. This approach was time-consuming, error-prone, and unsustainable as the volume of reports continued to grow. The organisation also lacked automation, centralised data access, and tools for historical analysis.
To address these challenges, we implemented an automated and scalable analytics solution that reduced analysis time from hours to minutes, improved data accuracy, and enabled transparent, filterable reporting aligned with the client’s evolving business needs.
PROJECT TIME
2024
INDUSTRY
Oil & Gas
COUNTRY
Saudi Arabia
The client
Who have we helped?
Our client is a growing Saudi company, a leader in the oil and gas industry in the GCC region, with extensive expertise and experience in delivering oil–well operation and measurement products and services.
REQUIREMENTS
Business challenges
The primary goal was to develop bespoke software capable of extracting key information from specific fields within PDF documents and automatically populating the client’s database. A significant challenge lay in the high variability of the incoming reports — each file differed in structure, field count, and layout of critical data, which made manual verification both time-consuming and error-prone.
ACTIONS
Project execution process
Conducted a thorough review of client requirements, focusing on understanding the structure, logic, and inconsistencies within PDF reports generated by an external provider.

Solution
Scope and delivery model
We developed the data extraction and import software using the .NET framework. A custom algorithm was created to locate keywords within PDF files based on coordinate mapping, extract the relevant information, and insert it directly into the database. The system continuously monitors a designated folder and, at regular intervals, detects and processes any newly added files. The entire mechanism is fully configurable, allowing the client to adjust parameters — such as keywords — without additional development work.
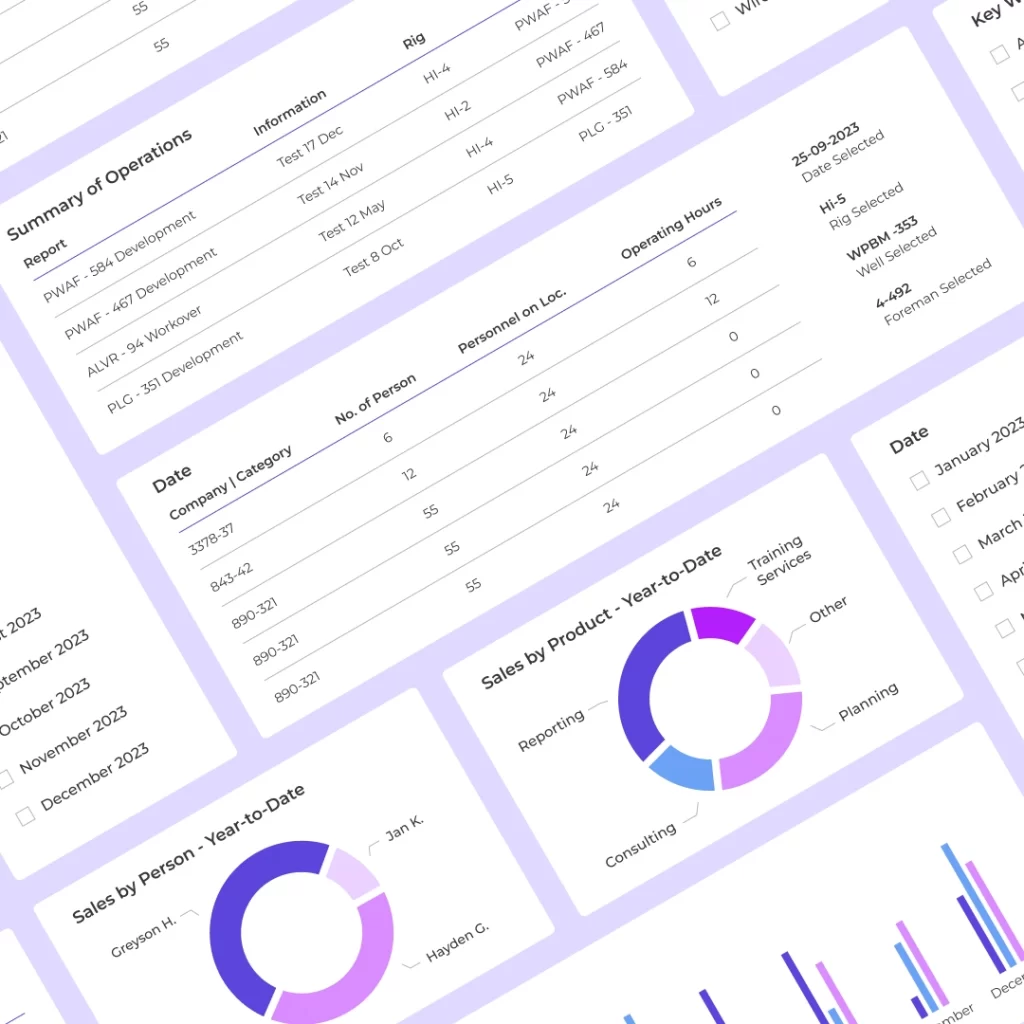
To further enhance operational efficiency, we integrated the database with Power BI, delivering a sophisticated, user-friendly dashboard. This enabled employees to access filtered, aggregated, and clearly visualised operational data — greatly reducing the time required to find and verify critical information.
Moreover, the system stores historical data, allowing users to explore trends, generate forecasts, and revisit specific timeframes directly within the Power BI environment. This has equipped the client with powerful tools for both real-time insights and long-term strategic analysis.